What is observability?
Observability means knowing what’s going on inside your system just by looking at things like logs, metrics, and traces.
While monitoring tells you if something is wrong, observability helps you understand why it’s wrong.
When Do We Need Observability?
We need observability when:
- We are running complex systems like microservices
- We are fixing slow performance or unexpected errors
- We want to see how healthy our system is or how much resources it uses
Even for our personal laptop or local projects, observability is helpful:
- We can find what’s slowing things down
- We can watch memory, CPU, and disk usage
- We can practice using tools that are used in real-world systems
Tools We’ll Use
- Prometheus to collects and stores metrics
- Node Exporter to export system metrics (CPU, RAM, disk, etc.)
- Grafana to visualize metrics with dashboards
Setting Up Everything with Docker
1. Project Setup
Create a folder and files:
mkdir obervability && cd obervability
touch docker-compose.yml prometheus.yml
2. Docker Compose File
docker-compose.yml
services:
  prometheus:
    image: prom/prometheus
    container_name: prometheus
    ports:
      - "9090:9090"
    volumes:
      - ./prometheus.yml:/etc/prometheus/prometheus.yml
    command:
      - '--config.file=/etc/prometheus/prometheus.yml'

  node_exporter:
    image: prom/node-exporter
    container_name: node_exporter
    ports:
      - "9100:9100"
    volumes:
      - /proc:/host/proc:ro
      - /sys:/host/sys:ro
      - /:/rootfs:ro
    command:
      - '--path.procfs=/host/proc'
      - '--path.sysfs=/host/sys'
      - '--collector.filesystem.ignored-mount-points=^/(sys|proc|dev|host|etc)($$|/)'

  grafana:
    image: grafana/grafana
    container_name: grafana
    ports:
      - "3000:3000"
    volumes:
      - grafana-storage:/var/lib/grafana
    depends_on:
      - prometheus

volumes:
  grafana-storage:
3. Prometheus Configuration
prometheus.yml
global:
  scrape_interval: 15s

scrape_configs:
  - job_name: 'prometheus'
    static_configs:
      - targets: ['prometheus:9090']

  - job_name: 'node_exporter'
    static_configs:
      - targets: ['node_exporter:9100']
3.1. Why We Use prometheus:9090 Instead of localhost:9090 (Especially in Grafana)
When we use Docker Compose to run Prometheus, Node Exporter, and Grafana, each service runs inside its own Docker container. And in Docker:
localhostinside a container refers to that container only, not the host machine or any other container.- So, if Grafana tries to connect to
localhost:9090, it’s actually trying to connect to itself, not Prometheus.
3.2. What Should We Use Instead?
We use the Docker service name – like prometheus:9090 – because Docker Compose automatically creates a shared network where each container can be reached by its service name.
So in our prometheus.yml, when Prometheus scrapes Node Exporter, it uses:
static_configs:
- targets: ['node_exporter:9100']
And in Grafana, when configuring the Prometheus data source, you should use:
http://prometheus:9090
3.3. Why This Matters for Grafana
Grafana is in its own container, so if you enter http://localhost:9090 as the Prometheus data source:
- Grafana thinks you’re pointing to its own container’s localhost.
- But Prometheus isn’t running inside the Grafana container.
- Result: Connection refused or no data found errors.
Using http://prometheus:9090 tells Grafana:
“Talk to the container named prometheus on port 9090,”
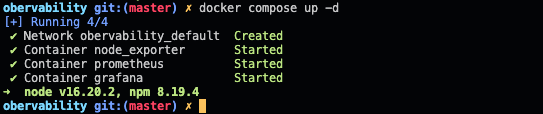
4. Start All Services
docker compose up -d
4.1. Node Exporter on http://localhost:9100
4.1.1. What Is http://localhost:9100/metrics?
This URL is exposed by Node Exporter. It shows metrics about our system, like CPU, memory, disk usage, etc., in a format that Prometheus understands.
When you open this in your browser, you’ll see something like:
# HELP node_cpu_seconds_total Seconds the CPUs spent in each mode.
# TYPE node_cpu_seconds_total counter
node_cpu_seconds_total{cpu="0",mode="user"} 12345.67
node_cpu_seconds_total{cpu="0",mode="idle"} 67890.12
...
4.1.2. Is There a Pattern to This?
Yes! The format is key-value pairs with optional labels.
- Metric name:
node_cpu_seconds_total - Labels:
{cpu="0", mode="idle"}— extra info about the metric - Value:
67890.12— the actual measurement
Note
So each line is like:
<metric_name>{<labels>} <value>
This is called the Prometheus exposition format.
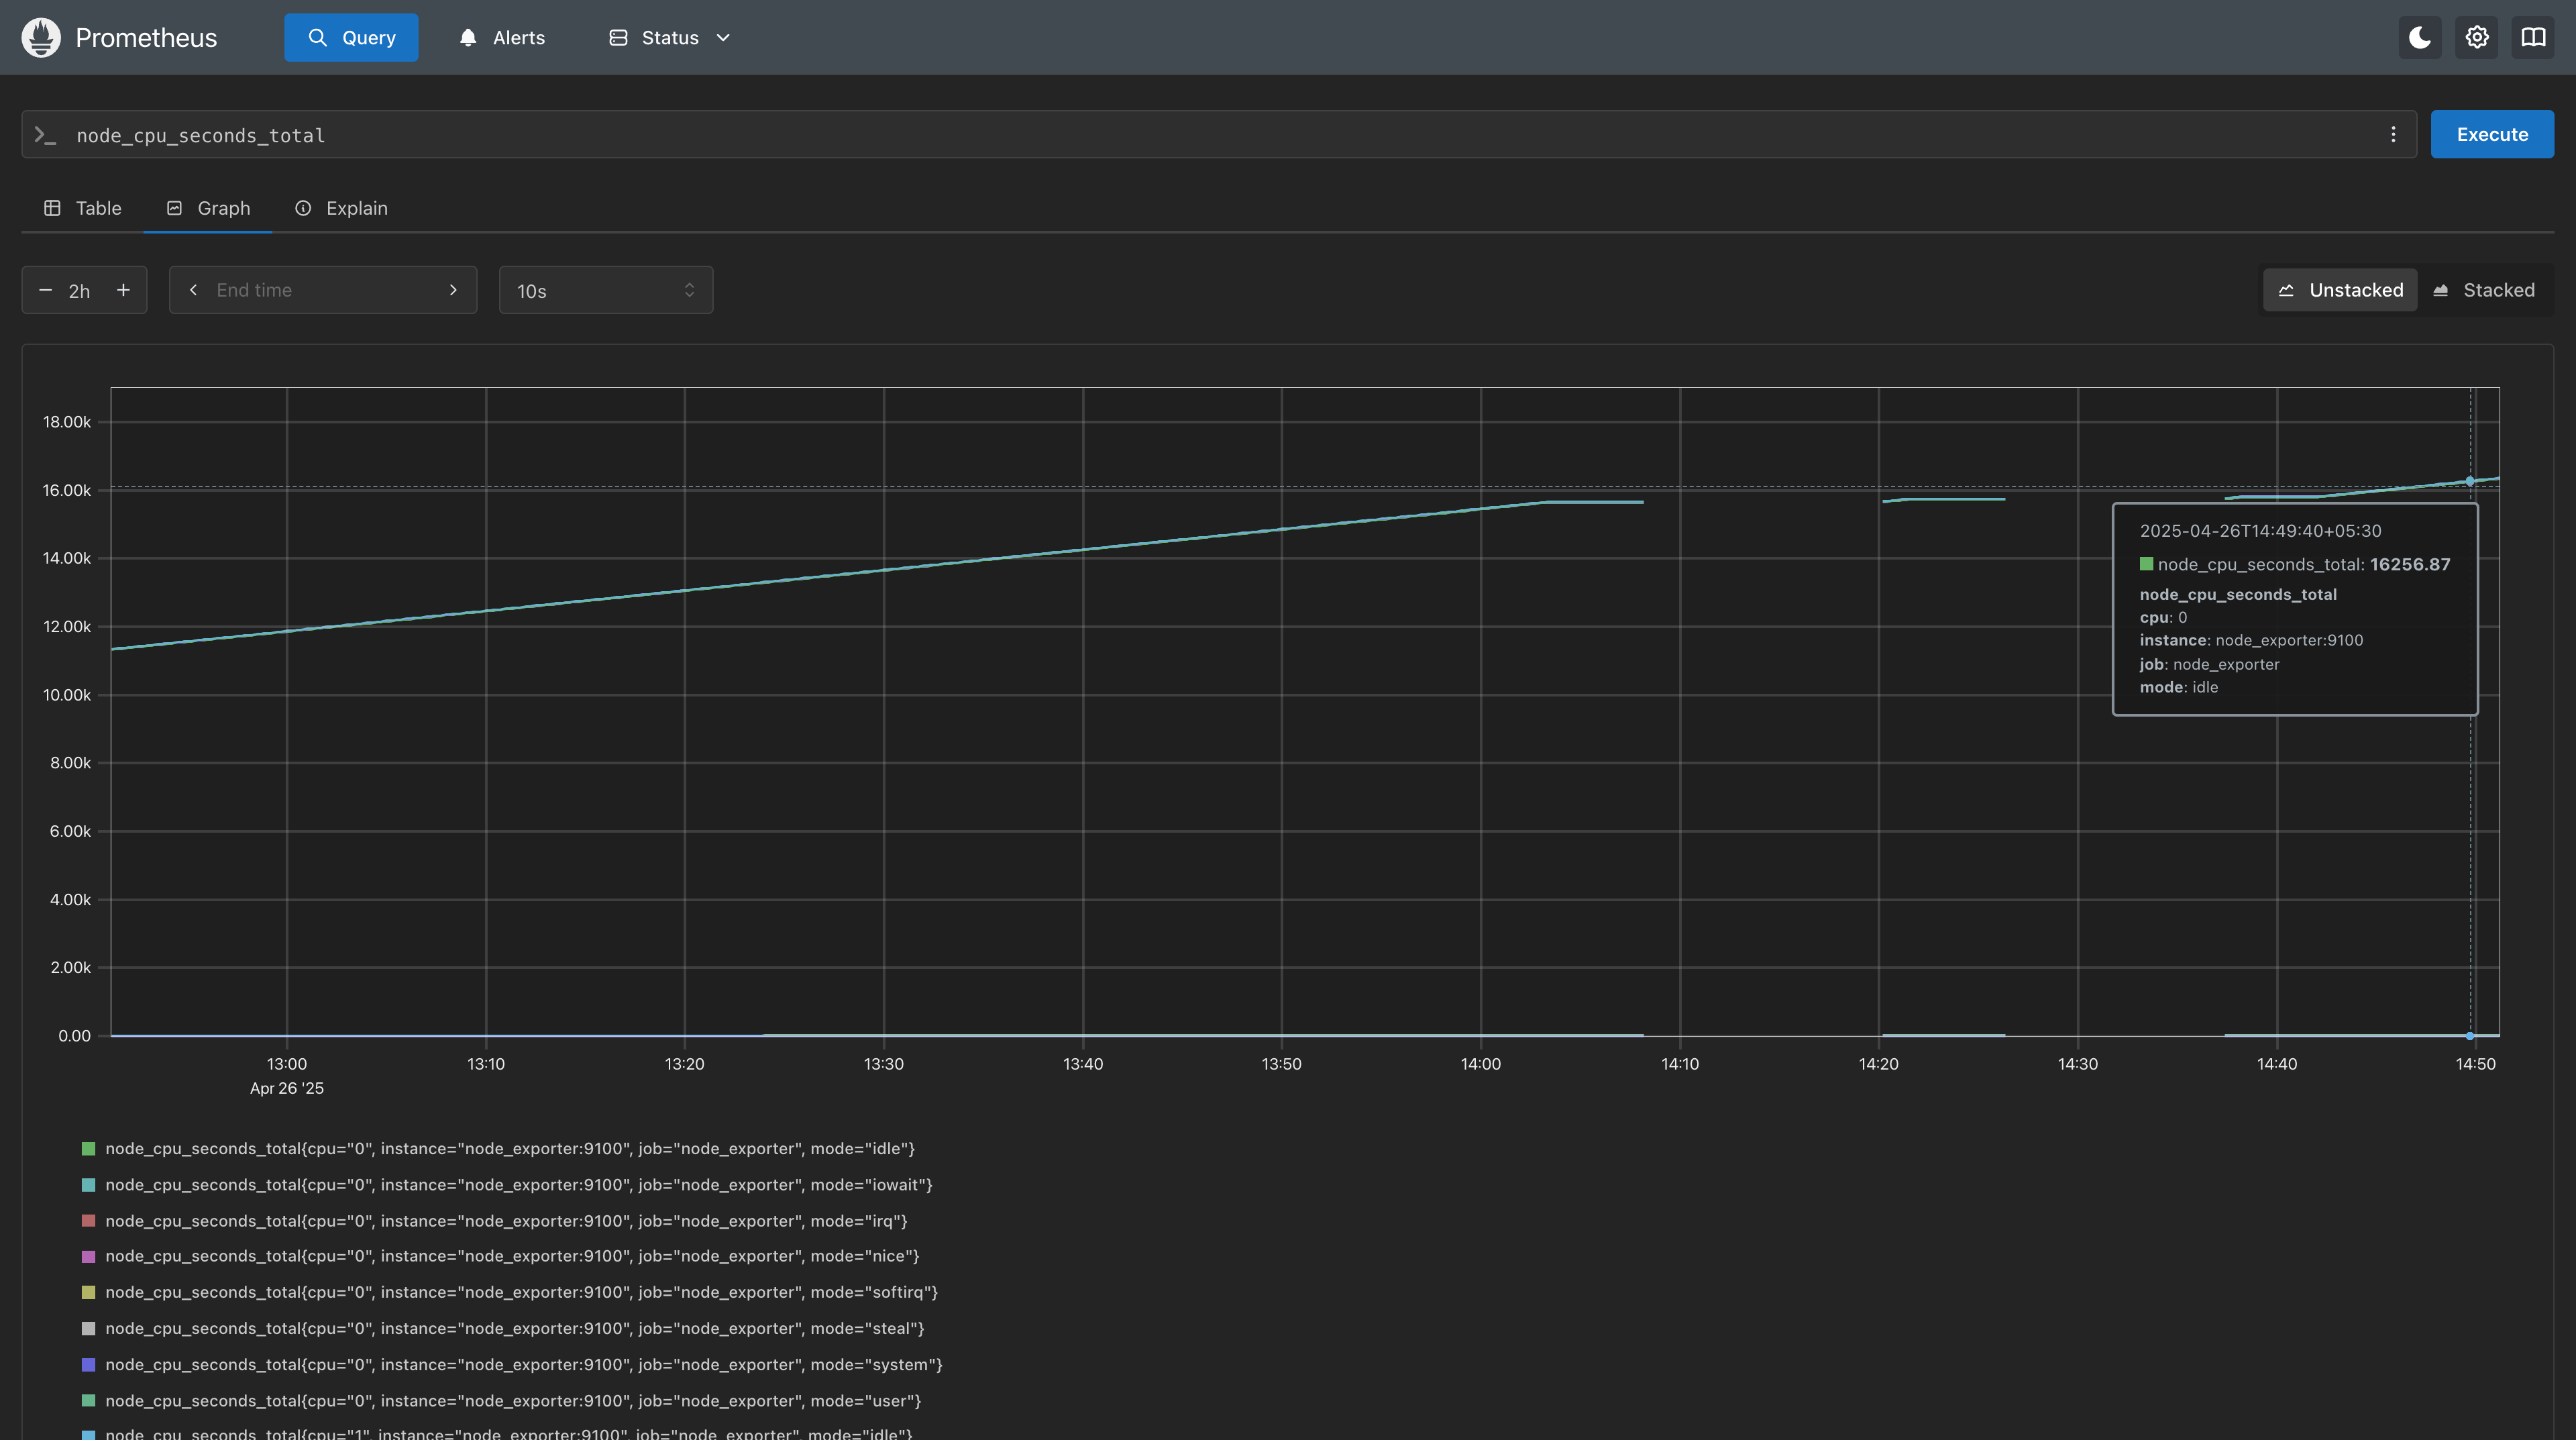
4.2. Prometheus running on http://localhost:9090
Once Prometheus is up, you can explore the collected metrics by visiting the “Graph” tab.
Let’s try a basic query using one of the key metrics exposed by Node Exporter:
node_cpu_seconds_total
This metric tells you how many seconds your CPU cores have spent in different modes like user, system, idle, etc.
After entering node_cpu_seconds_total in the query box and clicking Execute, you’ll see a list of results like:
node_cpu_seconds_total{cpu="0",mode="idle"} 345678.9 node_cpu_seconds_total{cpu="0",mode="user"} 12345.6 node_cpu_seconds_total{cpu="1",mode="system"} 7890.1 ...
Each line represents:
- Metric name:
node_cpu_seconds_total - Labels (inside
{}): extra details like which CPU core and which mode - Value: total seconds spent in that mode
You can pick any metric you find under http://localhost:9100/metrics (the Node Exporter endpoint) and try querying it in Prometheus.
4.3. Grafana on http://localhost:3000
- (login with `admin` / `admin`)
5. Connect Grafana to Prometheus
- Go to Grafana (
http://localhost:3000) - Go to Settings → Data Sources
- Add a new data source:
- Type: Prometheus
- URL:
http://prometheus:9090 - Click Save & Test
6. Import a Prebuilt Dashboard
Grafana has a popular dashboard for system metrics.
- Click the "+" → Import
- Use Dashboard ID
1860(Node Exporter Full) - Select the Prometheus data source
- Click Import You should now see real-time CPU, memory, disk, and network metrics from your system!
Conclusion
In this guide, we learned what observability means — it’s about understanding what’s happening inside a system just by looking at the information it gives us. This helps us keep our systems running smoothly.
We set up Prometheus to collect system metrics, used Node Exporter to share our machine’s data, and connected everything to Grafana to see it all in beautiful dashboards.
By the end, we had a complete local monitoring setup that lets us watch our system’s performance in real-time through interactive dashboards!